Workspace overview
News combines a live feed, market chart, open orders, and positions. The right sidebar switches between Trading and Agent. Opening Agent in a floating window leaves trading controls visible beside the chart.
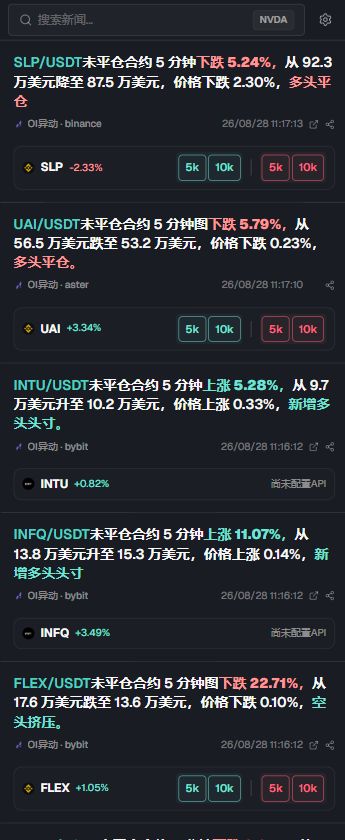
One story can relate to several markets. Quick-order amounts are account settings; scores, price changes, and publication times are examples from the captured feed.
Read a news card
A card maps an event to one or more related markets. Market rows can show a venue, ticker, short-term change, per-market AI rating, and account-configured quick orders. Read the news score and bullish, bearish, or neutral label alongside the source and publication time.
| Field | How to use it |
|---|---|
| Headline | Identify the event without treating it as confirmation |
| Source | Judge authority and open the original page |
| Time | Separate new information from recirculated content |
| Related market | Select the ticker, then verify venue, pair, and market type on the chart |
| Rating and change | Prioritize attention without treating the score or price move as a conclusion |
| Quick-order amount | Appears only when available and enabled. The value comes from account settings; it is an order control, not a rating or feedback button |
| Link | Verify the full context at the source |
Search and filter
Related markets merge aliases for the same symbol and prefer the default CEX selected in Trading settings. The page restores the last opened market after refresh; still verify the venue and pair.
- 01
Search a ticker or term
Wait for both the count and card list to update.
- 02
Apply source or category filters
Keep enough sources to compare the event across outlets.
- 03
Adjust the display
Set density, font size, duplicate filtering, only-with-a-coin, and collapsed trading pairs in Feed settings.
- 04
Clear filters when results disappear
Check spelling, scope, and whether Only with a coin is enabled.
Check the chart
Select a ticker and verify the venue, pair, market type, and timeframe. With news markers enabled, hover or select a source logo to open a card. Chart news must match the current asset and score above 70, using that asset’s own score when present; the chart does not include every story in the feed. Media logos or X author avatars identify sources, and direction cues accompany the card’s long, short, or neutral label. Page through grouped stories, drag the card header to clear the chart, use Share for a poster, and close it from the top-right.
Stock events use their own Show US Stock Events switch and are not subject to the news score threshold. See the event calendar for upcoming dates.
Smart-money and whale details show a Market Position Concentration (HHI) percentage bar when data is available. It is not a price change or directional probability; a missing value does not mean zero concentration.
Chart display options also control historical trade markers: buys and sells within each candle are grouped into B and S markers, with trade count, average price, and total value for grouped trades.
Favorite intervals, indicators, drawing tools, and chart types in their menus; these favorites are saved in the current browser and remain after a reload or symbol change.
Stock-related markets show session status and the contract’s performance relative to the underlying quote. Where the TradingView data-source button is available on daily, weekly, and monthly intervals, use it to view stock candles and check which source is active.
For supported option-exposure data, click to pin the panel, switch between Net, Call / Put, and Table views, and choose strikes near the reference price or all strikes. Check the expiry coverage, units, and data time. Escape or a click outside closes the panel.
| View | What to inspect |
|---|---|
| Index price | Current contract price, index price, and their difference |
| Open interest and funding | Position changes, funding direction, and the next settlement time |
| Order book | Bid and ask depth, prices, and quantities; Hyperliquid supports a live L2 order book |
| Smart money | Long and short positions, trader counts, average entries, and profit or loss |
Order controls
Switch between Amount and Quantity and check the unit before entering a size. A manually selected leverage is used when the amount is adjusted; inspect the final value before submission.
When editing position take profit or stop loss, enter a price or percentage and review the trigger quantity, calculated price, and expected PNL. Expected PNL colors follow the sign of the result.
Take-profit and stop-loss percentages changed in the order panel are saved in this browser and take priority over Trading defaults on later orders. Recheck them after changing markets or reopening the page.
| Field | Check |
|---|---|
| Connection | Correct exchange or wallet and connected status |
| Pair | Same market used in the analysis |
| Side | Buy/long or sell/short |
| Order type | Market, limit, or TWAP on supported venues; check price or total size and duration as appropriate |
| Size | Currency, unit, and account exposure |
| Leverage | Expected liquidation risk |
| Take profit / stop loss | Trigger price and direction |
Orders and positions
After submission, confirm an order ID or explicit rejection. Check open orders and positions, filled size, average price, unrealized P&L, and attached take-profit or stop-loss orders. Supported tables let you switch the displayed amount or quantity.
After a 100% close, the page confirms that the position is zero before clearing take-profit and stop-loss orders for that side. Return to Positions and Open orders to verify both results.
Binance and Hyperliquid provide a TWAP tab; Hyperliquid also provides Top Trader. In Top Trader, filter All, Long, or Short, inspect addresses and positions, and add an address to wallet monitoring. Check position value, average entry, PNL, liquidation price, and data time.
Wallet monitoring card view groups addresses that share the same remark. Total PNL equals unrealized PNL plus cumulative funding; hover it to read both values. Pause freezes that monitor view until Resume is selected. The Notify switch controls alerts for the corresponding wallet.
Supported wallet-address controls open recent trade history. No trades in the last 7 days means that the selected period returned no trades.
Position PNL sharing lets you show an amount, a percentage, or both, and toggle price information. Expand related news to select up to 3 stories, then copy the image, download it, or share it to X. Review identity, position size, trade details, PNL, and the selected news before sharing.